


This report was updated on February 10, 2025 to reference Noble County, Oklahoma rather than Noble County, Ohio.
Most of the discussion around President Donald Trump’s volley of tariff threats this week has centered on their potential impact on consumer prices and inflation. While price increases are a real concern, another impact involves the fact that regional economies (and the local jobs there) are frequently caught in the middle of trade disputes, though not equally.
For now, the most significant disruptions to U.S. communities are on pause, given the last-minute suspension of Trump’s proposed tariffs on goods imported from Canada and Mexico. However, with Trump standing by his threat to impose 10% tariffs on imports from China, and China sticking with its threat of counter-tariffs commencing on Monday, the nation may well be heading toward a new reminder of the unfortunate ways local communities can suffer collateral damage from international faceoffs.
While the China clash will play out globally and strategically, its potential impacts will be localized and varied, since different regions have different local industry mixes and structures. Which is why it’s worth looking at the local geography of the pending trade war as an example of how national policy can hurt communities and their economies.
To explore how this works, this analysis builds on previous Brookings Metro work from 2018 by assessing which places have the most jobs in industries targeted by China’s proposed retaliatory tariffs. While this piece focuses specifically on Chinese retaliation, it also provides a template for assessing the place-specific economic side effects associated with any future trade tensions, such as if Mexico and Canada reimplement their retaliatory tariffs.
In the current case, China has announced retaliatory tariffs on a total of 80 different manufactured and energy products that the U.S. exports there. China will place 15% tariffs on a set of energy exports, including coal, natural gas, and petroleum; and 10% tariffs on 72 manufactured products or parts including trucks, motor homes, and agricultural machinery. These 80 products correspond with 14 different six-digit North American Industry Classification System (NAICS) industries in the U.S.1
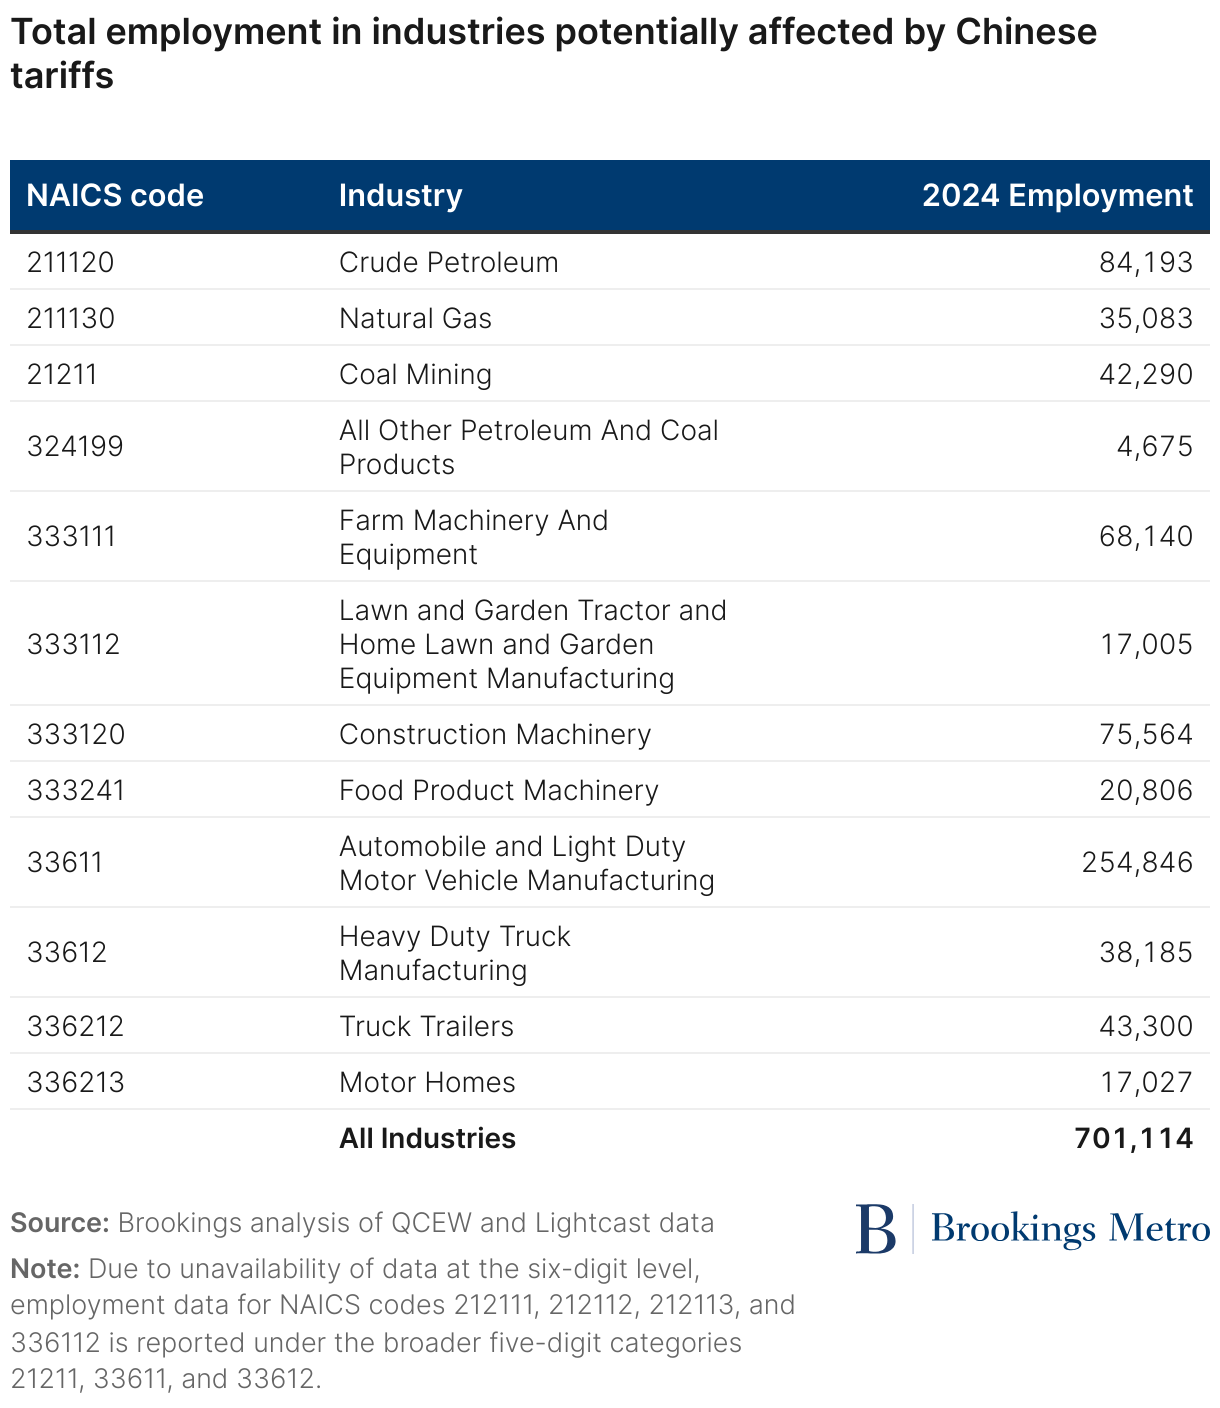
All told, these industries account for between 400,000 and 700,000 jobs in the United States.2 The tariff list contrasts with the much broader tariffs China levied in 2018, which affected 40 industries that supported over 2 million U.S. jobs. In comparison, this round of tariffs is significantly more straightforward in nature, creating a shorter product list and more concentrated economic impacts. While it’s not entirely clear why China is not retaliating with the same level of intensity as it did in 2018, it’s possible that seven years of escalating bilateral tariffs and substantial U.S. export restrictions have simply left the Chinese government with fewer levers to pull when it comes to new trade barriers.
Looking at how this may play out across the map of U.S. counties with the largest shares of jobs in industries China’s tariffs target reveals which places are most significantly exposed to potential supply chain disruptions. While the median U.S. county has just 0.05% of its jobs in potentially affected industries (and over 80% of all counties have less than 1% of their jobs in affected industries), there are some notable outliers.
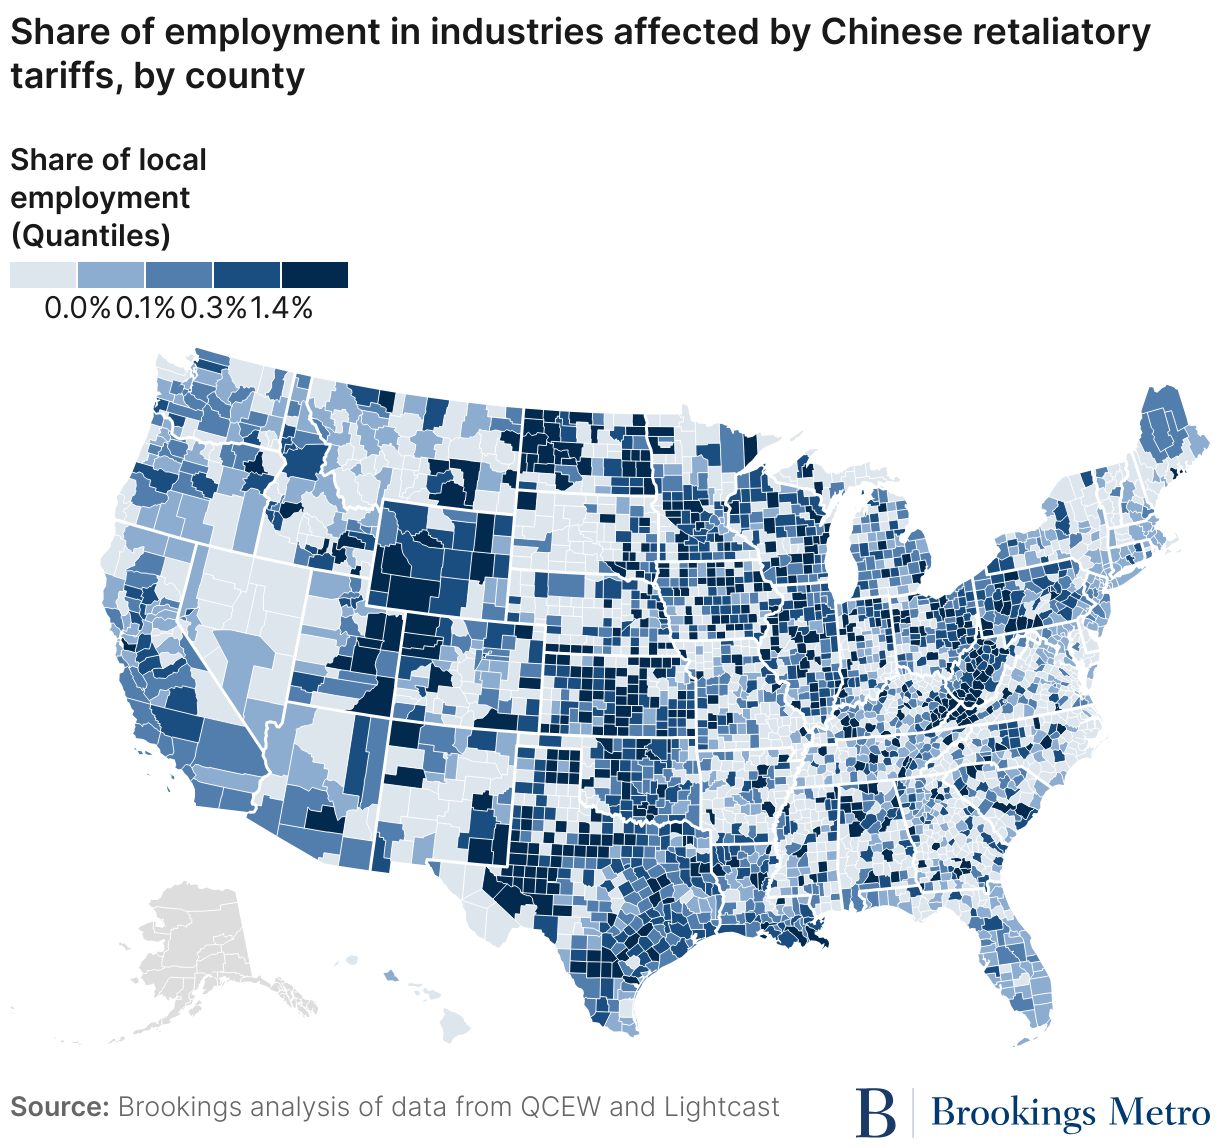
Similar to the 2018 tariffs, the industrial heartland is again bearing a disproportionate impact from Chinese retaliation. Some of the most intensely affected counties are energy and manufacturing communities in North Dakota, Indiana, Ohio, Kentucky, Alabama, and West Virginia. For instance, Sargent County, N.D. has the highest potential exposure of any county due to its large manufacturing presence, with 59% of its employment in industries potentially affected by the tariffs. Other counties that may be highly affected include Gibson County, Ind. and Noble County, Oklahoma (both of which are manufacturing hubs), and Irion County, Texas, which relies heavily on oil and natural gas, each with more than 30% of their employment in industries potentially affected by the proposed Chinese tariffs.
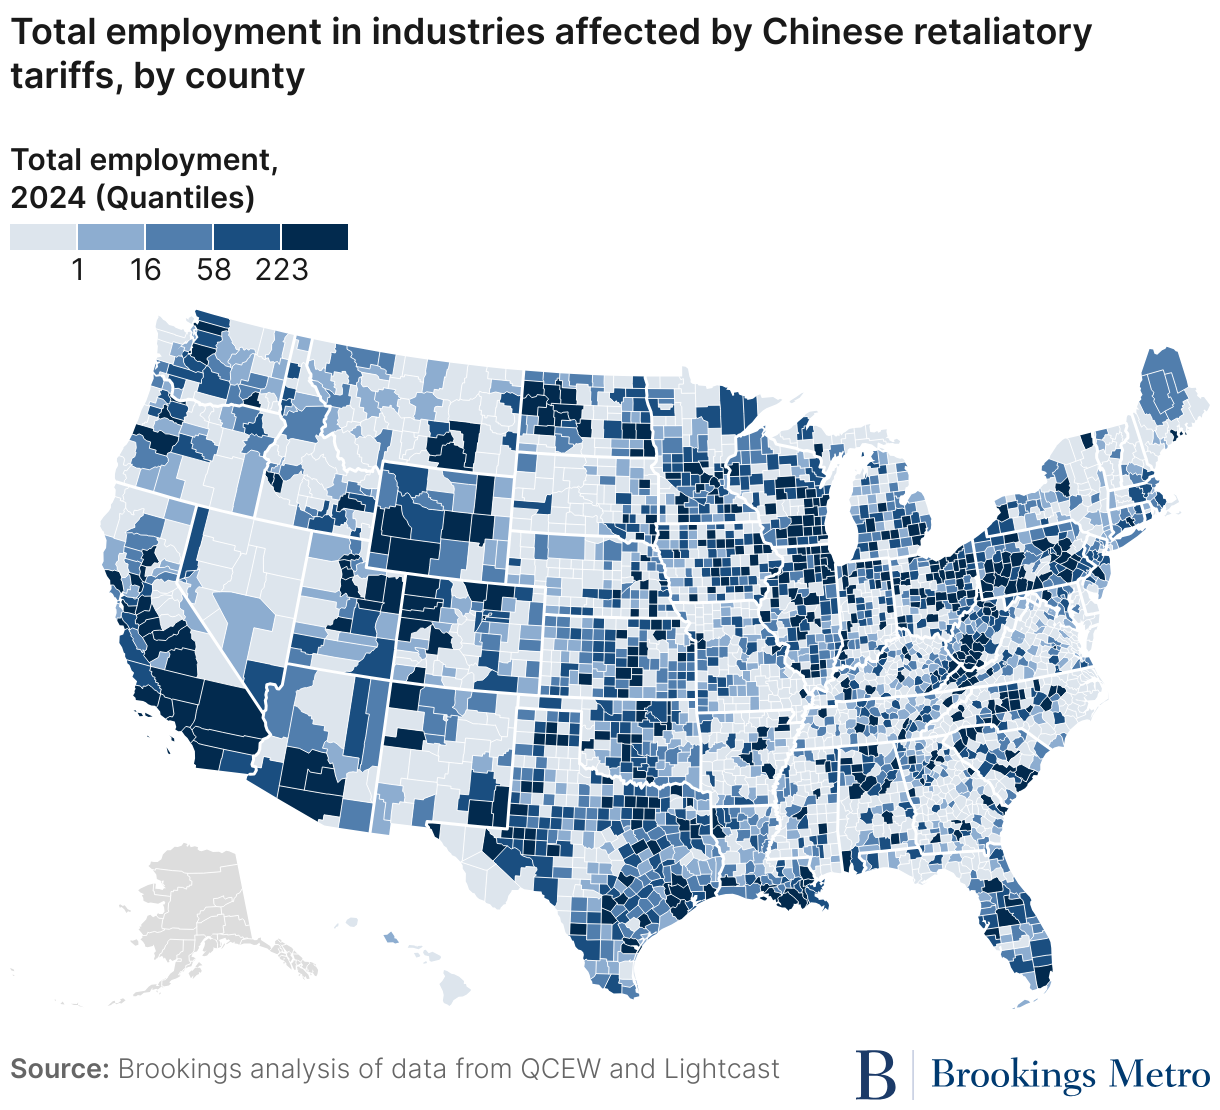
Turning to total employment in affected industries across particular regions, there are significant concentrations of these jobs in major energy-producing places such as Harris County, Texas (33,000 jobs), as well as manufacturing hubs such as Wayne County, Mich. (26,000); Alameda County, Calif. (25,000); Jefferson County, Ky. (13,000); and Elkhart County, Ind. (12,000).
In sum, these maps of U.S. exposure to Chinese tariffs reiterate that while trade skirmishes are frequently discussed in terms of geopolitics and consumer prices, they also entail very tangible local impacts on regional industry clusters, supply chains, and jobs.
Given how closely this new round of tariffs is associated with Trump’s policies, it also bears discussing how Chinese retaliation may affect communities where a majority of voters supported him compared to communities that supported former Vice President Kamala Harris in the 2024 election.
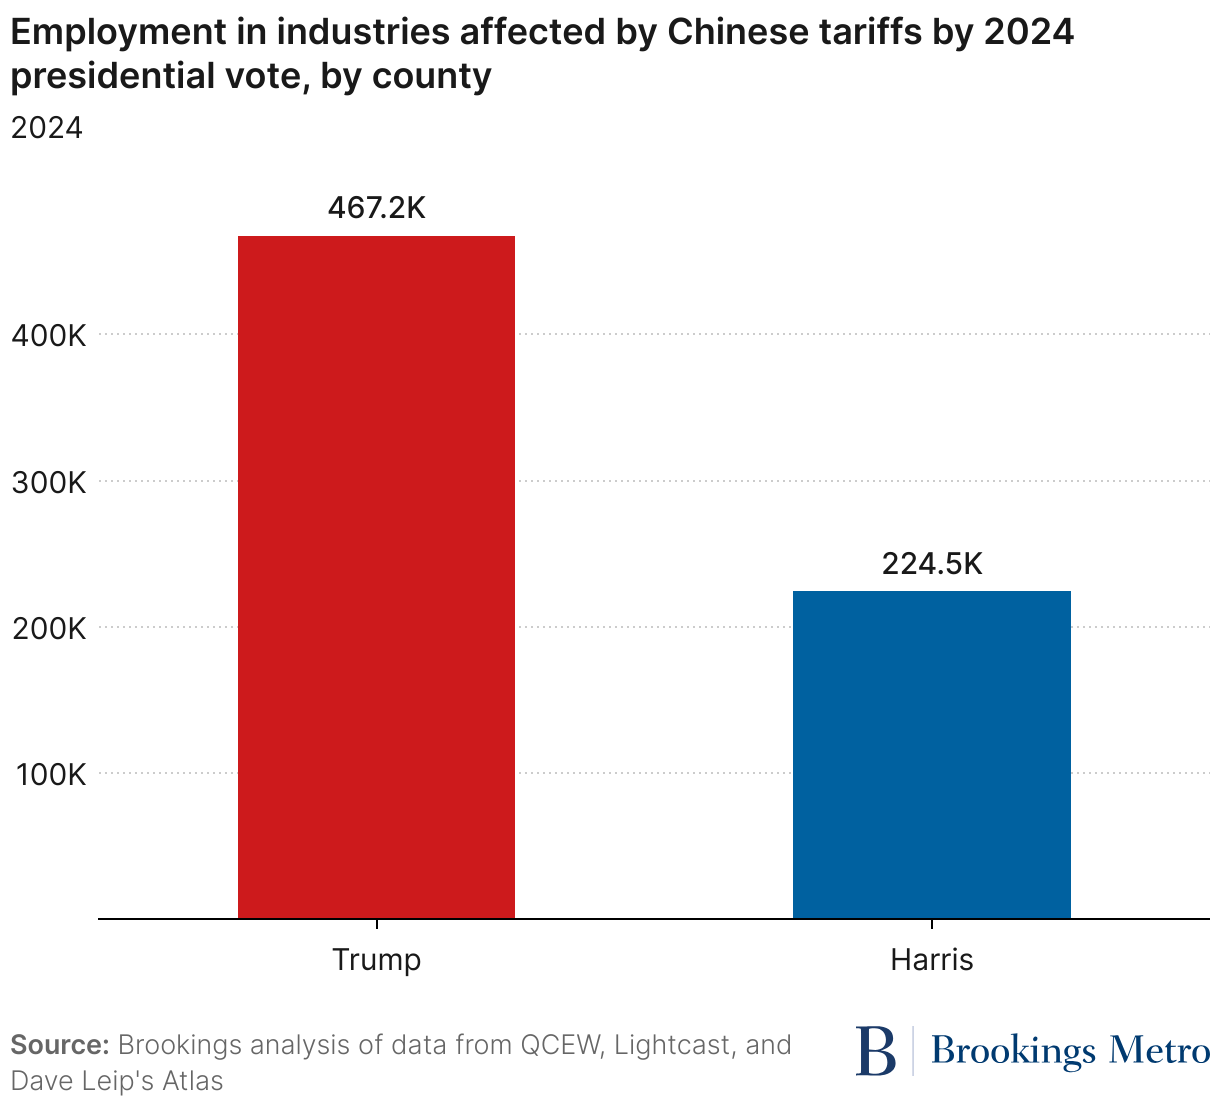
The four largest counties with industries that Chinese tariffs could impact all voted for Harris, led by Harris County, Texas, which is centered on Houston and its substantial oil and gas industry.
However, while several large, Harris-voting counties stand to be affected, on balance nearly two-thirds of all jobs in affected industries reside in Trump-voting counties.
This again stands in contrast to China’s 2018 tariffs, when employment in affected industries was more evenly divided between Trump-voting counties and counties that voted for Hillary Clinton in 2016. While it’s impossible to fully say how much political motivation played a role in this new set of retaliatory tariffs, it’s clear that Trump-voting counties will feel a bigger burden than Harris-voting counties this time around.
Many of the most tariff-exposed counties are found in the industrial heartland and Southeast regions, which formed Trump’s electoral base in 2024, including Elkhart and Gibson counties in Indiana; Macomb County, Mich.; Irion County, Texas; and Spartanburg County, S.C.
And because the vast majority of counties overall voted for Trump, a significantly larger number of Trump-voting counties have employment in tariff-affected industries than those that voted for Harris. Of the 2,010 counties with employment in tariff-affected industries, 1,722 of them voted for Trump compared to just 288 for Harris.
So, while Democratic representatives in Illinois may have constituents affected by the manufacturing tariffs, the burden of Chinese retaliation as a whole is more likely to land on places that voted for Trump and his Republican allies in Congress.
Notably, all 71 counties with 10% or more of their jobs in industries exposed to tariffs voted for Trump in 2024. Combined with previous Brookings Metro work showing that Trump-voting counties account for a smaller share of gross domestic product due to their rural nature, this draws attention to smaller communities that are dependent on key tariff-affected industries, and their special sensitivity to disruptions in global trade flows.
All in all, it bears noting that the proposed tariffs are the latest in a long string of protectionist actions across the Trump and Biden administrations that have forced supply chains to shift and relocate. And while previous rounds of tariffs and U.S. export controls may have left China with fewer options to retaliate than it had seven years ago, these latest trade actions might nonetheless still cause disruptions for U.S. firms, workers, and communities.
As this analysis shows, tariffs—both those implemented by the U.S. as well as foreign retaliation—have real effects on employment in places across the nation, and a continued expansion of protectionism and retaliation is likely to cause substantially more disruption for more American workers.
Authors
-
Footnotes
- Five of the 14 six-digit NAICS industries do not have employment data publicly available. To ensure full coverage of all products affected by the tariffs, the author team used five-digit NAICS industries, which are more expansive, in instances where six-digit industry data were unavailable. Because of this, the industry list in Table 1 only includes 12 industries: the nine six-digit industries that have data available, as well as three five-digit industries that correspond to the five six-digit industries with missing data.
- The low-end estimate of 403,000 jobs includes only jobs accounted for at the six-digit level, and as such, is missing data for five of the 14 six-digit NAICS industries. For example, the federal government does not provide employment data for six-digit NAICS industry 336112 (light trucks and utility vehicles), so this analysis uses five-digit NAICS industry 22611 (automobiles and light duty motor vehicles), which is inclusive of workers who produce both cars and light trucks. Because China did not impose tariffs on cars during this round of retaliation (only light trucks), the high-end estimate of 701,000 jobs, which includes a mix of five-digit and six-digit NAICS codes, is an overestimate of total affected employment.
The Brookings Institution is committed to quality, independence, and impact.
We are supported by a diverse array of funders. In line with our values and policies, each Brookings publication represents the sole views of its author(s).


